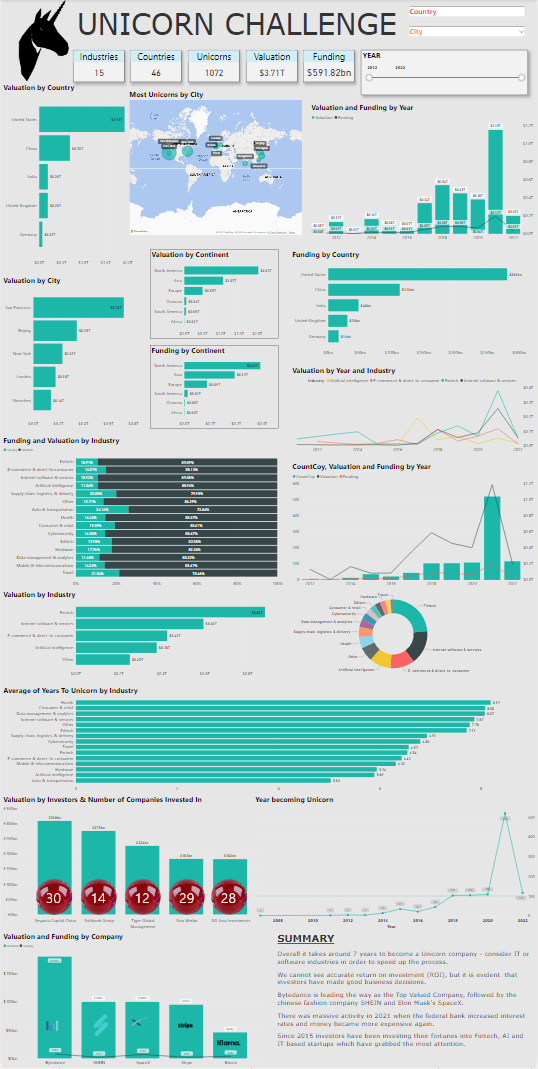
Unicorn Challenge
Unicorn Companies - Maven Analytics Challenge
I am still in the early stages of making a career progression into data visualisation, but I decided I would take part in my second Maven Analytics monthly challenge.
Although I did not officially submit my entry (as I started after the submission date), I really liked the subject and decided I would use this data set to really focus on using Power-BI to push my creative abilities and to get more familiar with Power-BI.
Until now, I had never added slicers, changed backgrounds, borders, text sizes, data titles, changed the canvas size etc... So this dashboard is quite an achievement for me. I prefer using power-BI, but being able to use both Tableau and Power-BI will be beneficial to my skill-set. QlikSense is also on my list to learn in more depth.
My next Maven challenge will be incorporating more matrix features including KPI's.
I would like to thank the great David Murray who helped me understand a lot along the way during this challenge! The biggest thing I have learnt is that visualisations / reports mean nothing without accurate clean data.
Although I set about this challenge with just one thing in mind...
to get more familiar with Power-BI (as I have only used Tableau until now) and complete a fairly good-looking dashboard.
The next step for me is to focus more on the cleaning of data - being able to edit / manipulate that data for more in-depth drill-down possibilities.
The long term goal is to explore custom charts and maybe even automate charts with the help of some Python...one step at a time!


Comments
Post a Comment